top of page

CASE0 RESULTS
(1) timeseries

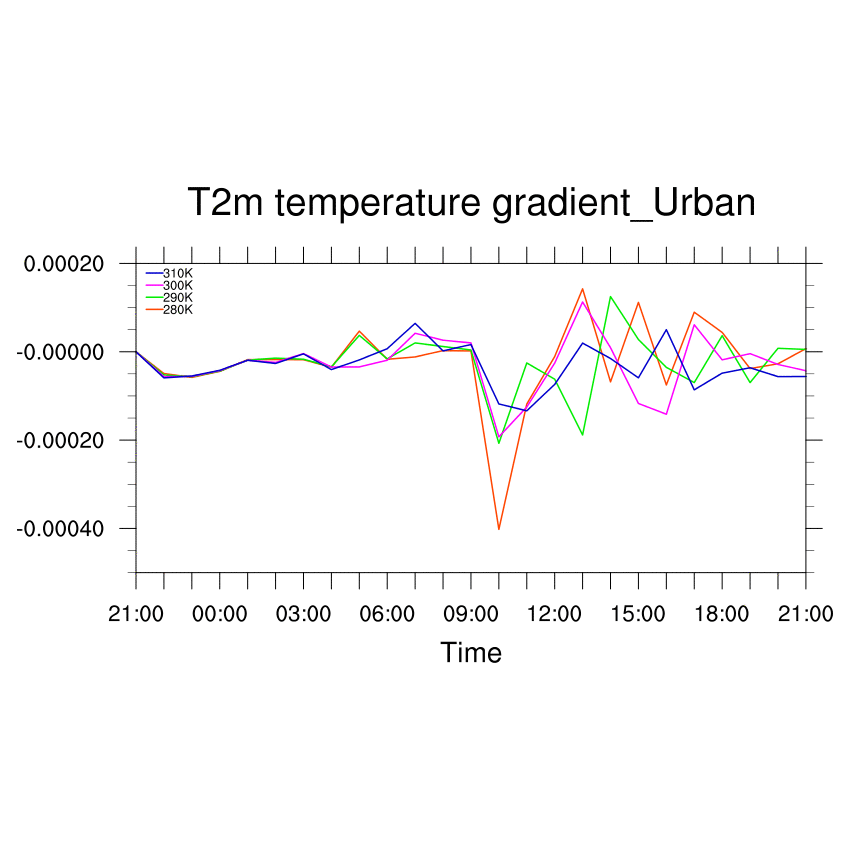
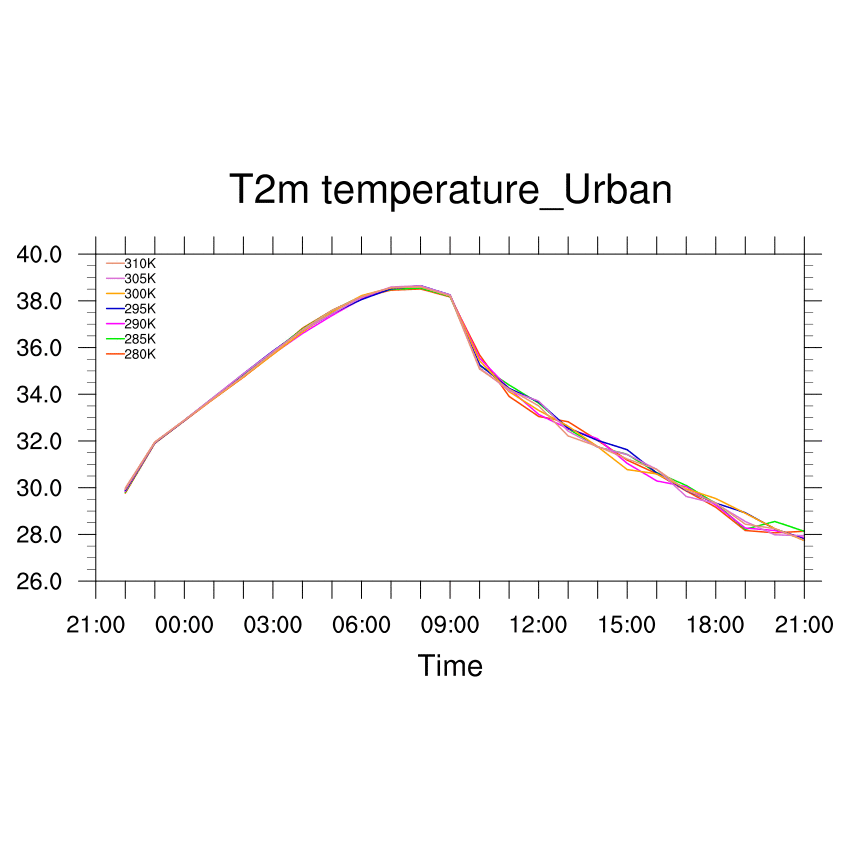


In the same urban composition (0-199 : urban) with the initial temperature as the only variable, min and max temperature is almost constant, on average 27.8838℃ and 38.5818℃, so that temperature difference of max and min temperature is almost same, on average 10.698℃.
(2) cross-section plots
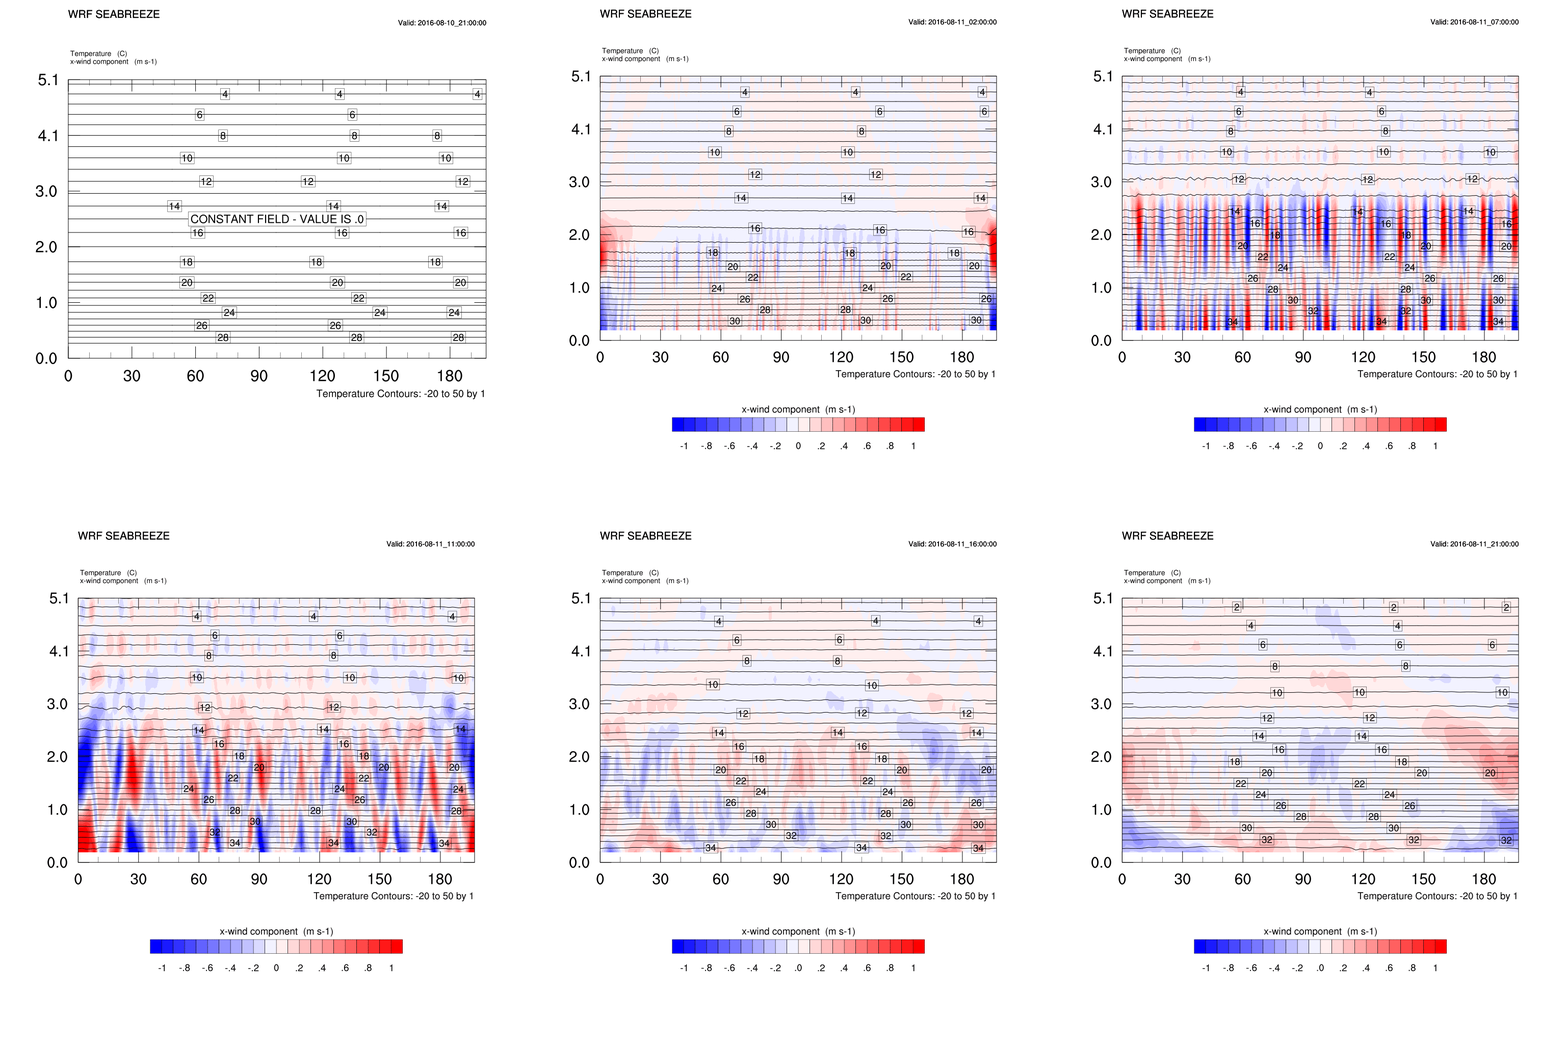
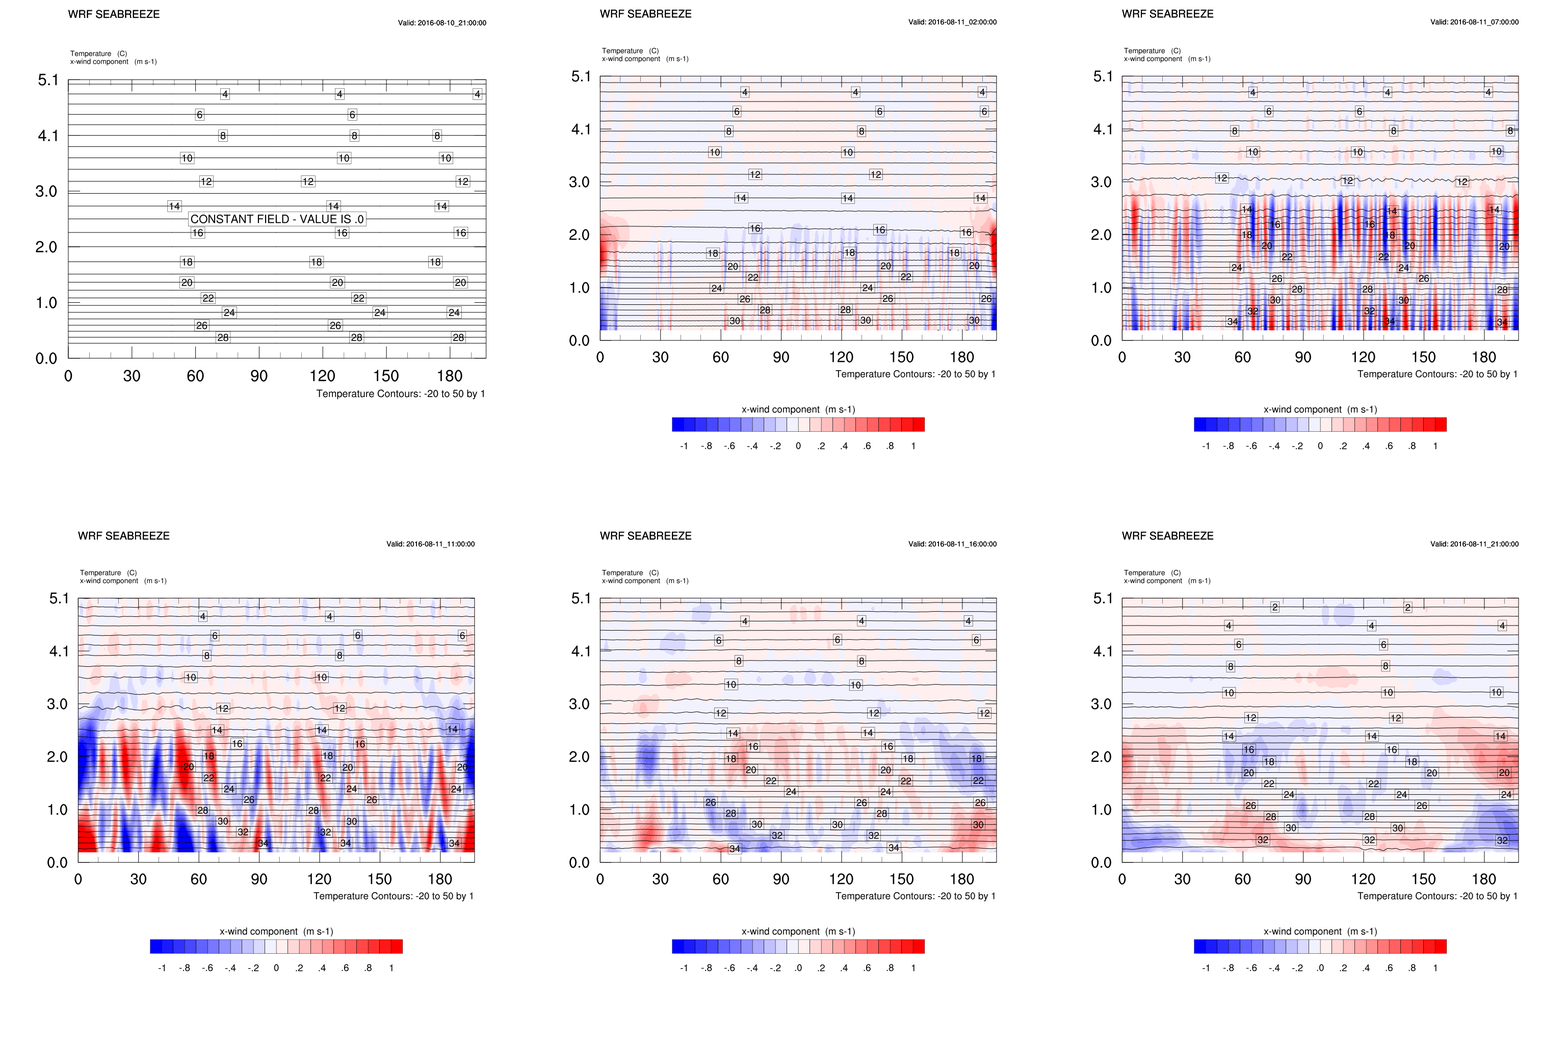

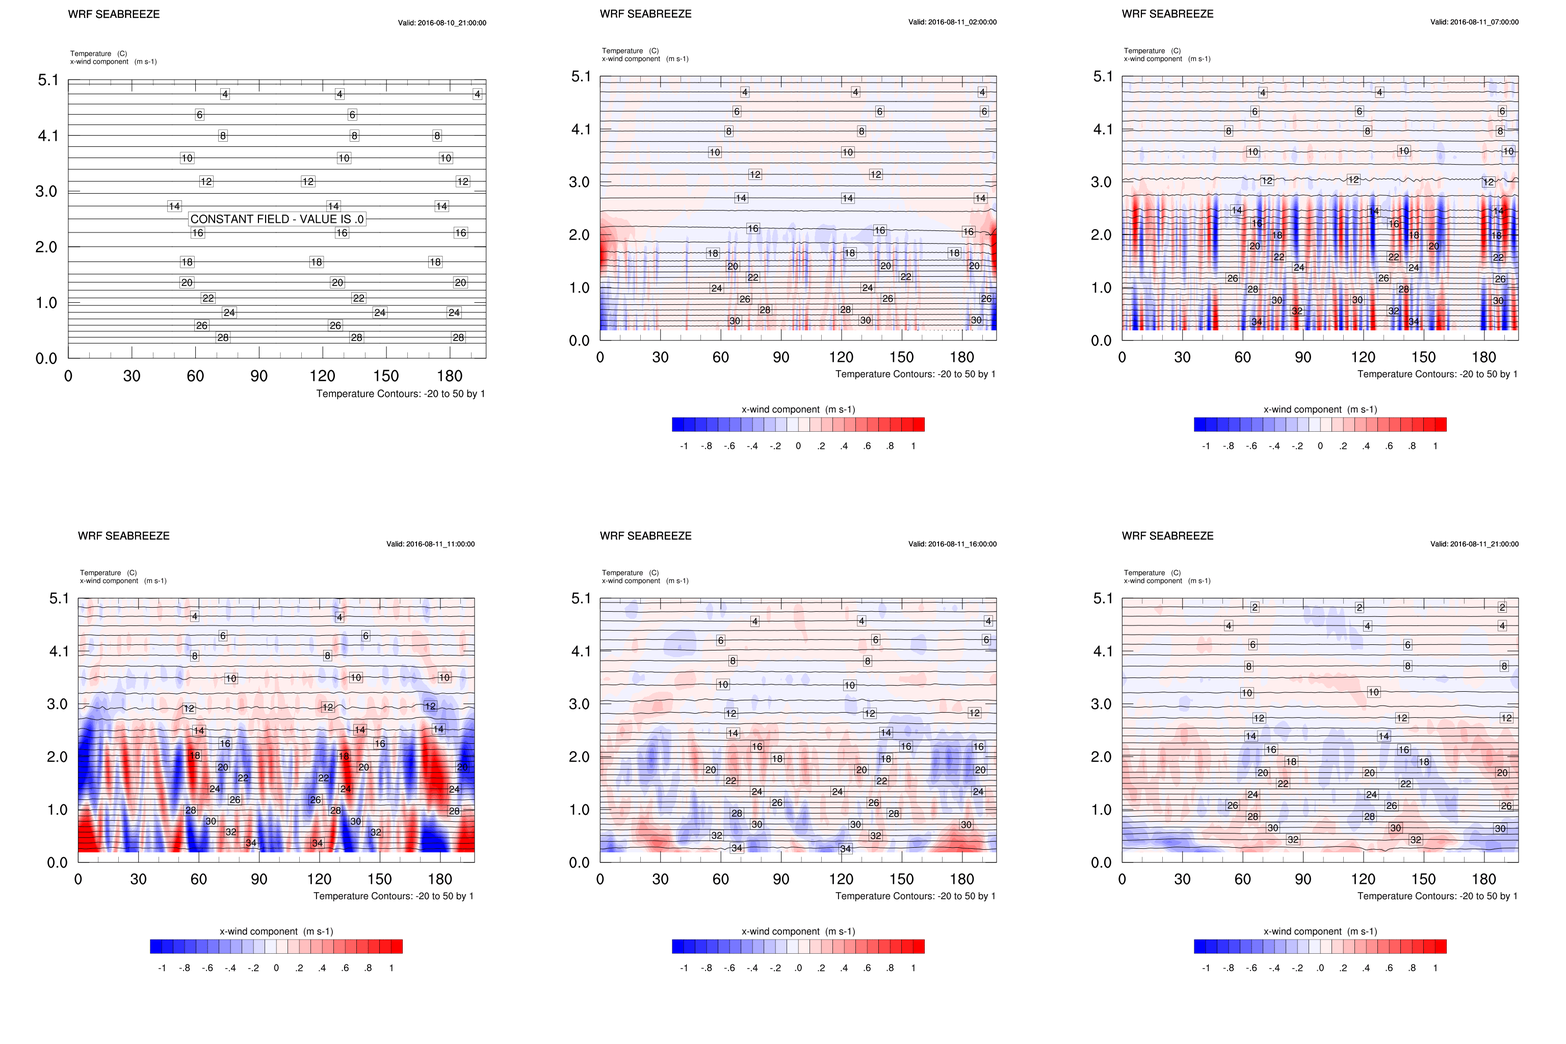
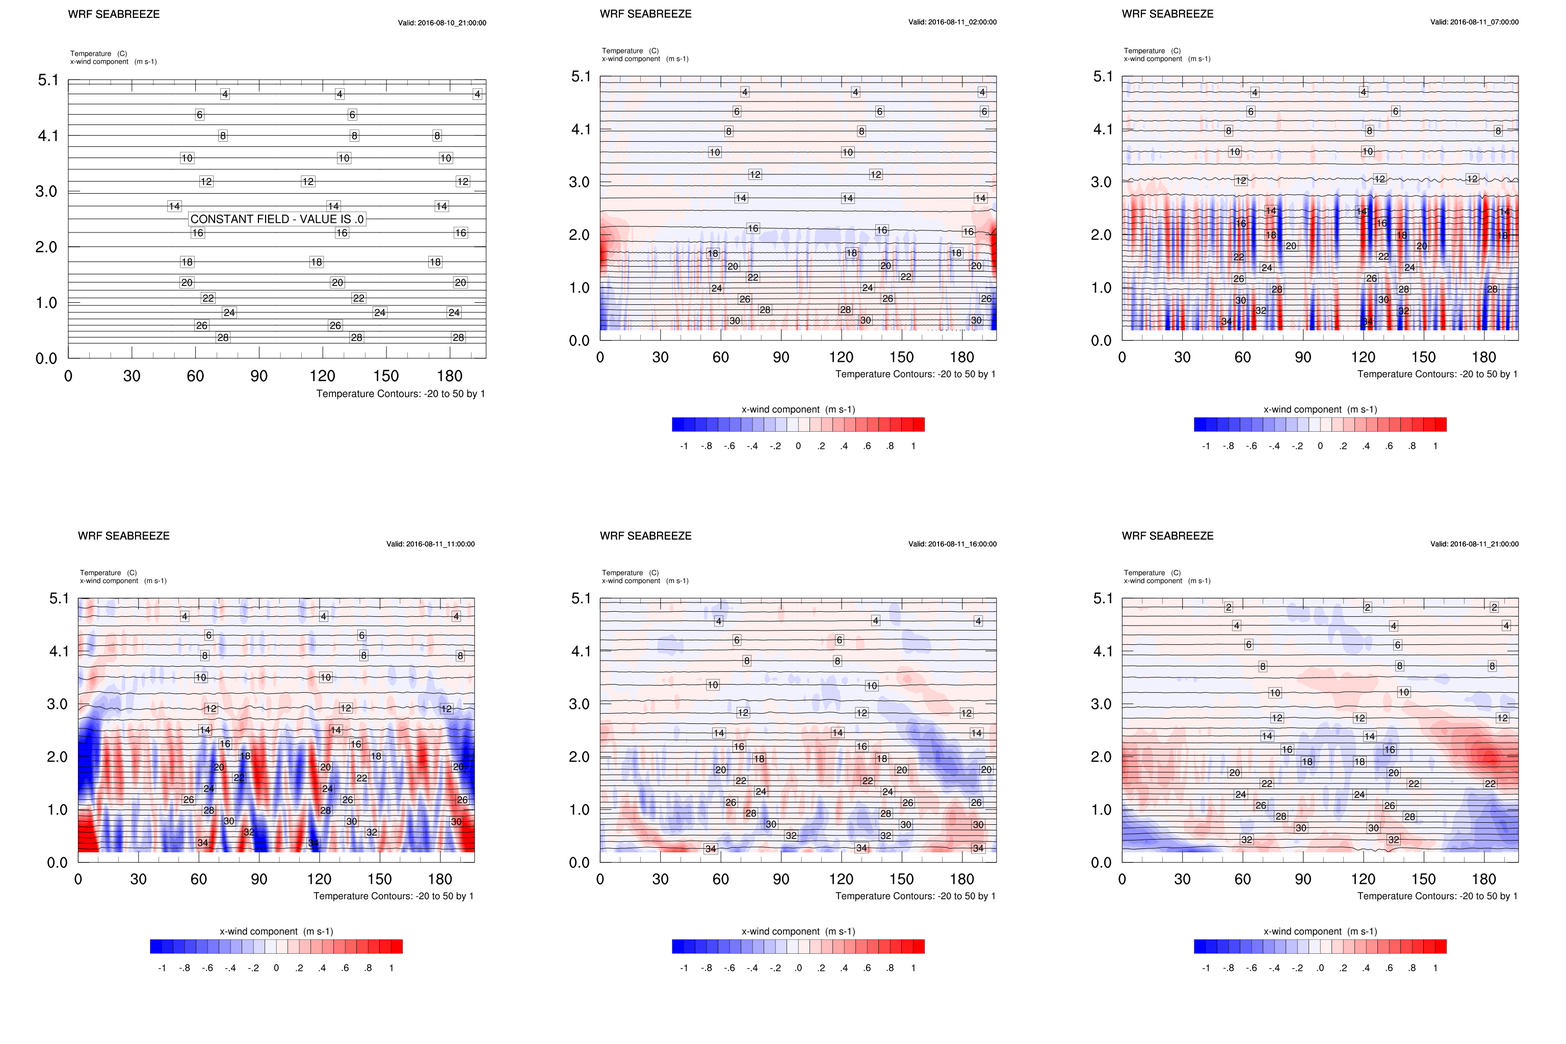


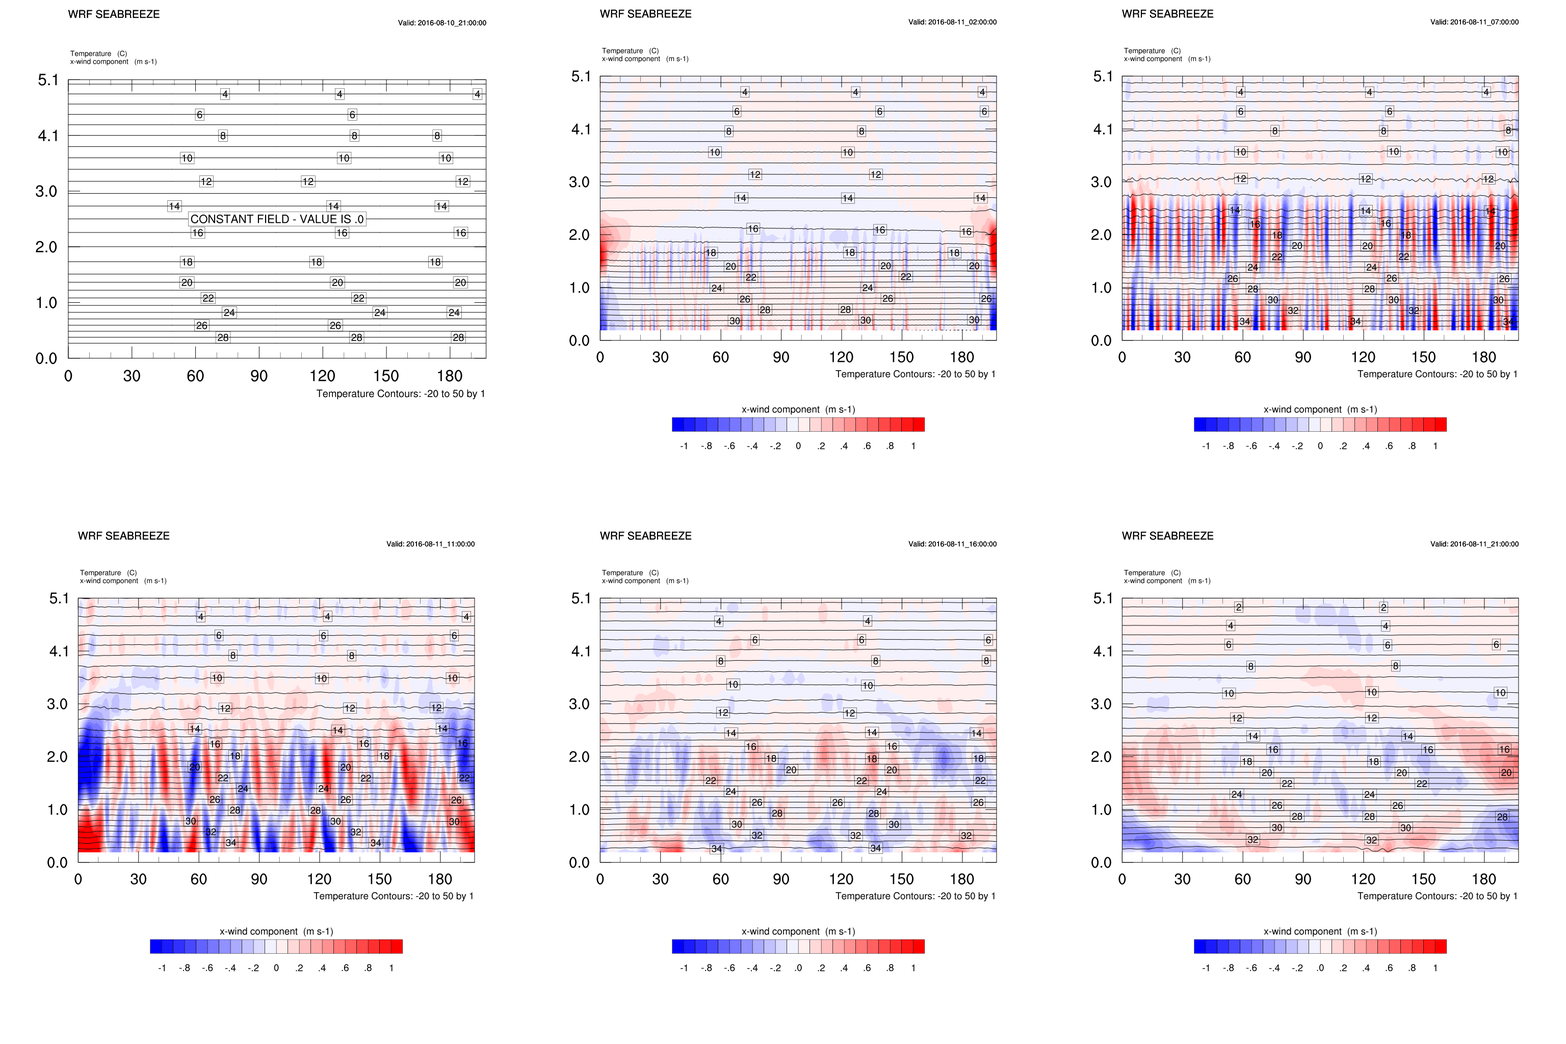
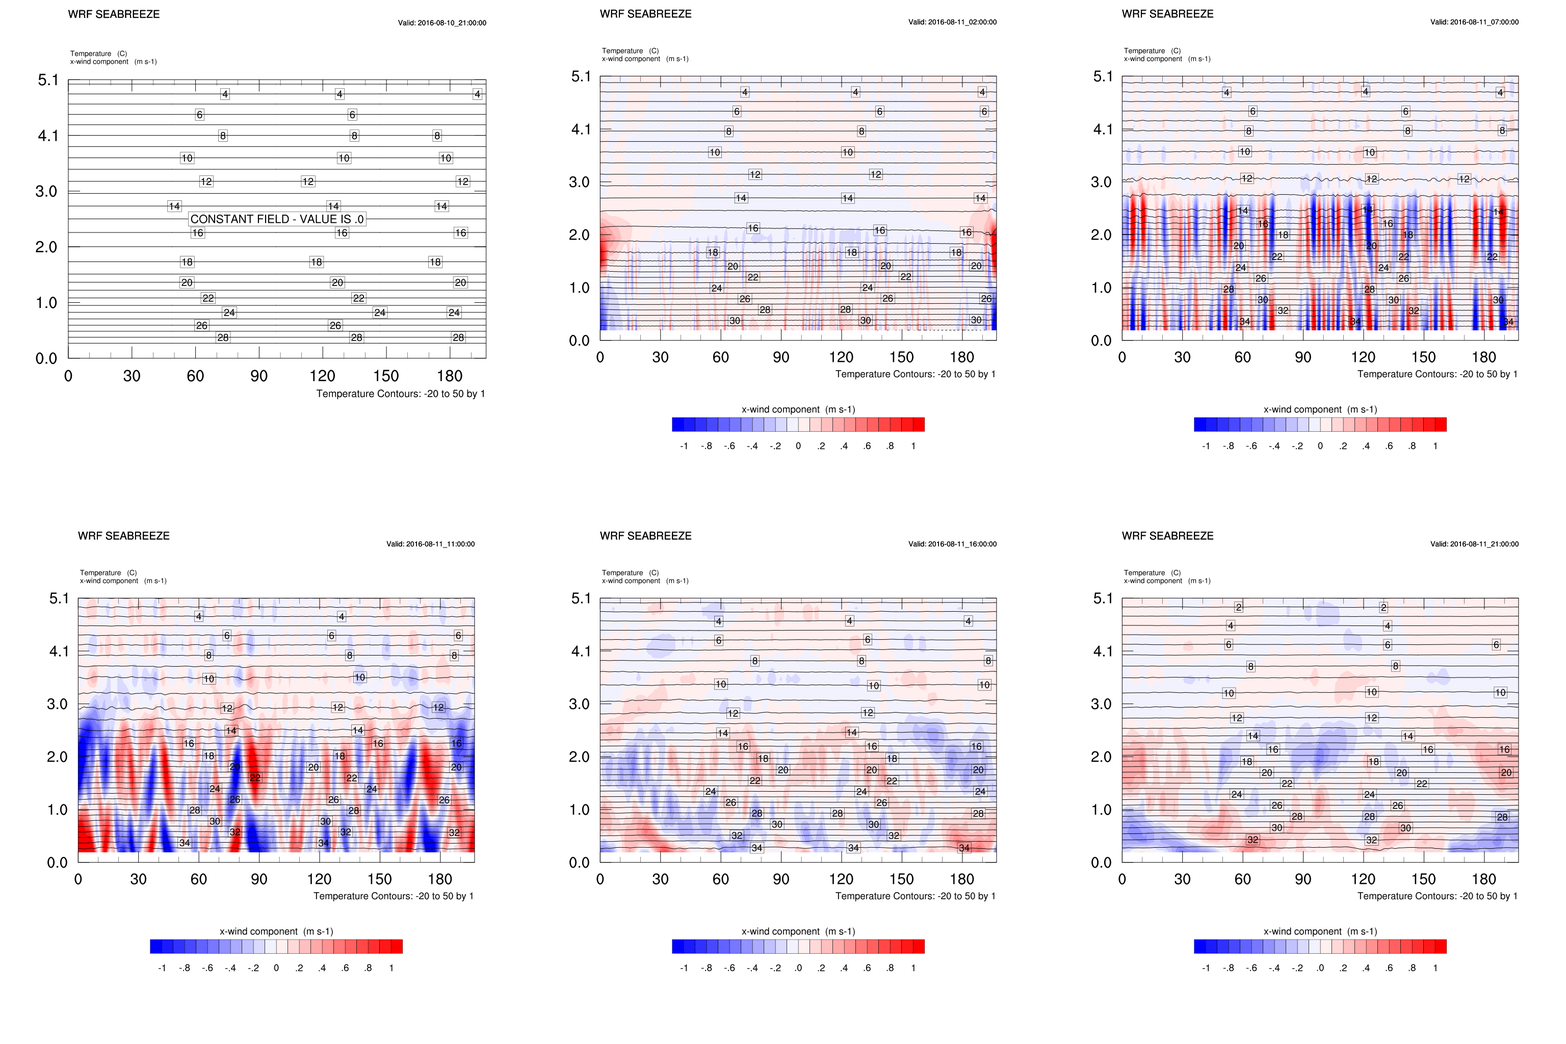
Due to almost same temperature change phase according to different initial temperature, shown in timeseries above, we could also find out that cross-section plots of x-direction wind and temperature is almost same with different initial temperature in Case0.
bottom of page